Rebuilding a SOC Homelab
I rebuilt my old Homelab to a more complete version.
The first version of this lab only watched the host. Wazuh caught brute-force logins, file tampering, and well, I was happy with it. However, that feeling died after I started re-reading my blog post about it. It felt like it was missing something, so I started searching and found it. It never saw a single packet. So, instead of piling more features onto the existing one, I rebuilt the lab to fix that issue, since I also wanted to try using VMs instead of running it on the host laptop itself.
VMs
The plan was to use a KVM/libvirt hypervisor to build the actual target on an isolated network. I came up with a name (My CTF team’s name), nxtserver. It was running on Ubuntu Server 24.04. This was so I could keep my host machine clean and so I could experiment with whatever I wanted to.
I installed Wazuh using Wazuh-Docker compose file, v4.14.5. Getting there was quite hard. There were a few issues like: changing the default admin password, my CLI tool silently never populating its valid username entries, a false-successful change-all flow that was a silent no-op because of how OpenSearch protects the reserved accounts, and a fix where docker cp errored replacing a file but was reporting it as a success. I only caught that by testing the old password again afterward instead of trusting the success message. securityadmin.sh, streamed in with cat > instead of docker cp, finally did it.
Next, I installed Suricata (8.0.6, official stable PPA). I honestly had no issues with wiring the eve.json into Wazuh, it was a lot simpler than I had initially anticipated. I expected a dedicated decoder or something complex. Now that I had both layers live, both correlating on their own, I could move on to the next step.
Three different attacks and why.
Same target, same window, three attacks, checking which layer, host or network, caught each one first, and why. All three landed on the same headline, network caught it and host didn’t, but each one exposed a genuinely different reason for that, which turned out to be the real finding, not three repeats of the same result.
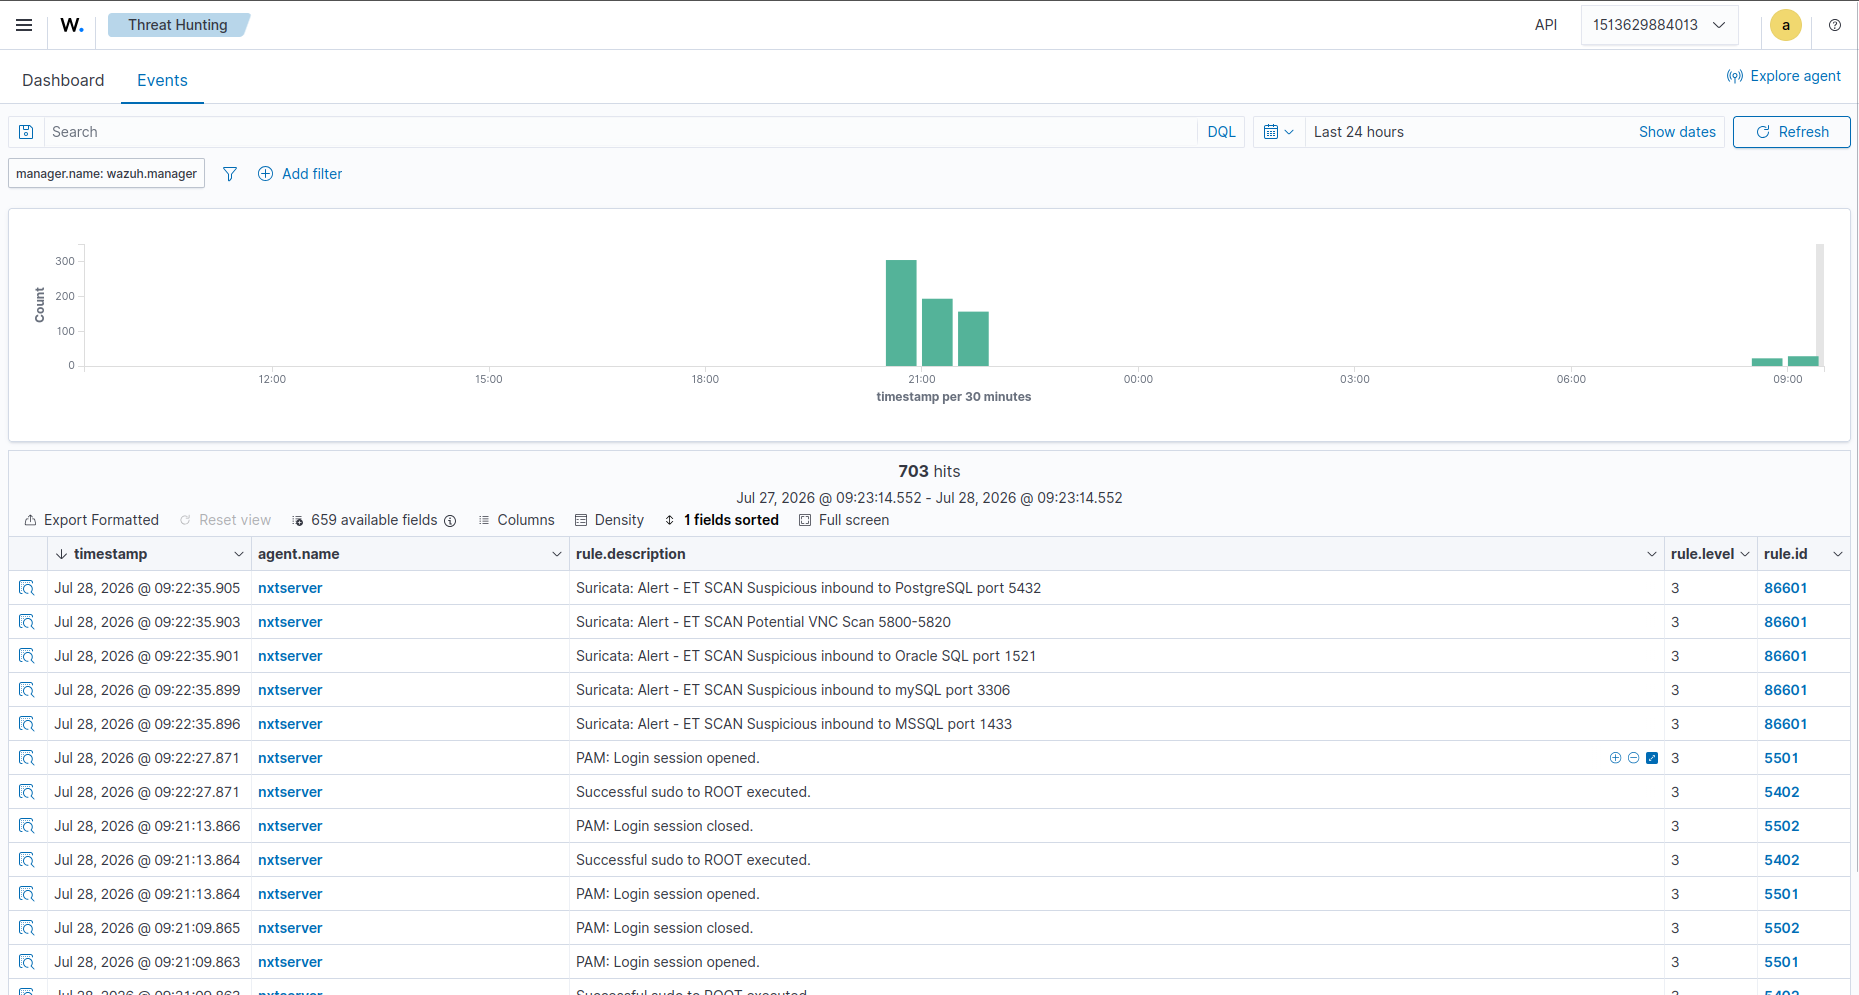
The nmap scan was structural blindness. A SYN scan never completes a handshake, so there’s nothing for a host sensor to observe, no matter how well it’s configured. Suricata saw it because it’s watching the wire, where the scan is fully visible whether or not a connection ever completes.
The Samba CVE exploit was different, a configuration gap. This one completes a real session, writes a file, and runs code, all of that is observable in principle. Wazuh saw none of it because nothing was pointed at the relevant signals, no FIM on the share directory, no smbd log ingestion, no process auditing. Suricata caught it three separate ways with zero target-specific tuning, the exploit trigger itself, the payload transfer, and the most interesting one, proof of root pulled straight off the wire from the plaintext command output crossing the channel after the shell landed.
The simulated C2 beacon was a gap one level deeper still, an alerting gap. Cron logs every execution to syslog automatically, no extra setup, and Wazuh’s agent does ingest syslog, the data was never missing. But nothing in the default ruleset promotes a plain CRON line into something that shows up as an alert. Suricata had a real answer even for traffic that was completely harmless and signature-free content-wise, ET Open’s HUNTING category includes a heuristic for curl’s default user agent hitting a raw IP address, and it fired on every single check-in.
Can’t see it at all. Could see it but isn’t watching. Is watching but isn’t alerting. That three-step ladder is the actual answer to the thesis question, and it’s a stronger point than “network wins, host loses” said three times over. One thing held constant across all three attacks too, a positive PAM and sudo trail from my own debugging SSH sessions showed up in every single dashboard query, sitting right next to the real alerts, proof the host layer was actively working the entire time, just never on the thing that mattered.
Can’t see it at all.
Could see it but isn’t watching.
Is watching but isn’t alerting.
Those three statements are the actual answer to the question. This is a lot better than saying ‘the network wins, and the host loses’ over and over again. This way, we can find out what we need to investigate, troubleshoot, and learn from.
Writing a custom rule!
The beacon attack left me a little stumped. ET Open’s signature caught the traffic, curl talking to a raw IP, but it couldn’t catch the usual C2 pattern behind it. One curl request looked identical whether it was a single, one-off request or one of several on a fixed interval. There’s no way you can tell those apart from the alert alone.
Periodicity Detection. Upon research, I stumbled upon this term. This detects when there’s suspiciously regular intervals which is a known trait of C2. However, this was not something Suricata, or at least to my knowledge, was capable of detecting. Based on my research, Suricata matches packets and flows, but not time-series patterns. Zeek or RITA could probably do that but I realized this was the perfect time to try making a custom rule. “Repeated Check-in”, that’s the name I gave the rule. I made it fire once a single source makes five or more similar detections in a five-minute window. Although the limitation is probably that if the C2 checked in every 5 or 10 minutes instead, it would probably miss it.
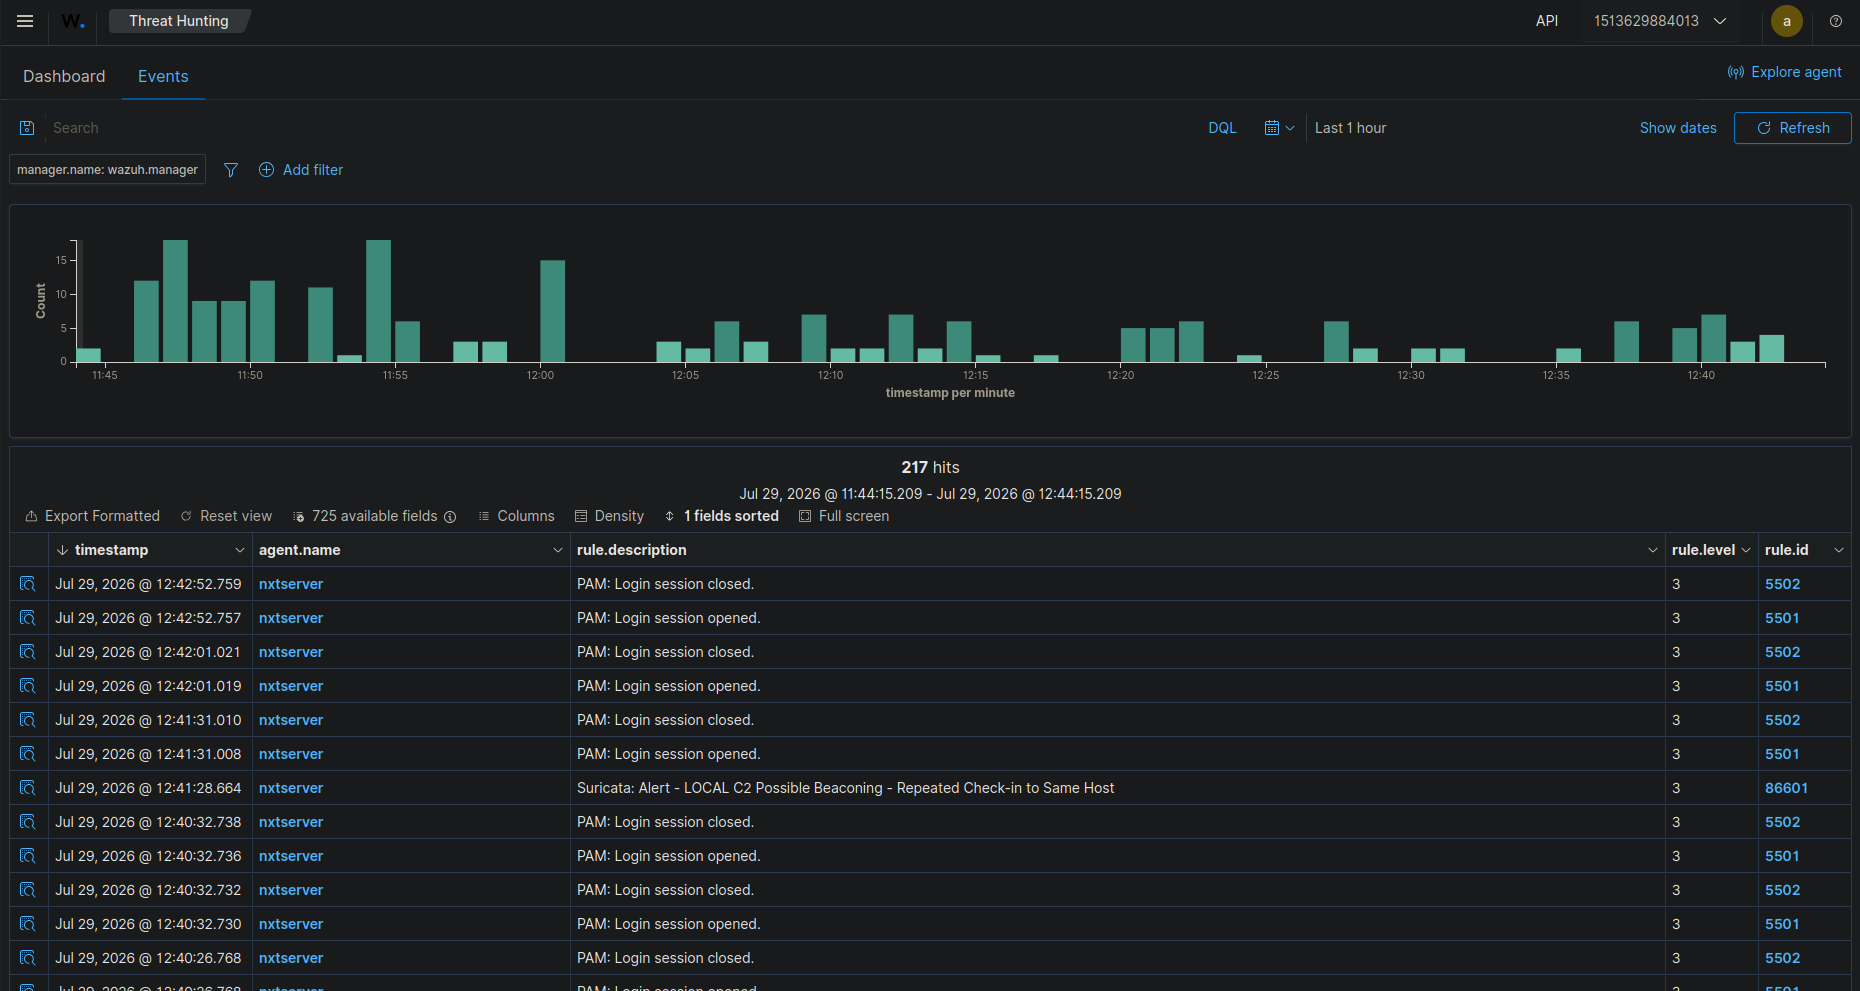
The rule logic checked out fast in Suricata’s own eve.json. Getting the alert to show up in the Wazuh dashboard took a lot longer, and turned into the most useful debugging exercise of the whole project. Along the way I found and fixed a real pre-existing bug, analysisd had been silently dropping alerts with Too many fields for JSON decoder errors, 371,504 times since Phase 2, caused by a decoder field-count limit sitting at its default. However, that wasn’t actually what was blocking this alert either. The real answer was simpler and, in hindsight, embarrassing! Every verification attempt had been checking the manager container’s local flat log file, and Wazuh’s newer indexer-connector architecture doesn’t reliably mirror into that file the way the real dashboard does. The alert had been reaching the dashboard the entire time. I only confirmed it by going and looking at the Discover view directly, instead of trusting the log file I’d been checking out of habit.
What I took away
My initial question was What does network monitoring catch that host monitoring doesn't. I expected one answer, a straightforward one. But during this whole project, I found more than one. Three different answers. The one thing that carried me across this whole project wasn’t the attacks or anything cool like that. Almost every problem I hit was the tool lying to me. A password change that wasn’t actually changed, a service that was “Active (running)” but wasn’t actually connected to anything, a log file that looked real but wasn’t. None of these failures really announced themselves, every one of them was only found after I checked more deeply. So in summary, what I took away was to never trust something blindly and to confirm it with my own research.
A note on how this got built
I used AI as a troubleshooting partner throughout this project, the same way I’d use documentation or ask a more senior engineer, not as something I pointed at a problem and walked away from. It was useful for forming a hypothesis fast, check whether the compose file still has the placeholder password in it, check filebeat test output before assuming the pipeline’s fine. Whether those hypotheses actually held, and catching the several times along the way that a tool told me it had succeeded when it hadn’t, was mine to verify every single time, and that verification step is most of what’s actually written up above.
Limits
This is a single-node lab, one VM playing target for everything, so it says nothing about how either layer holds up under real production traffic volume or a multi-host environment. The three attacks were also chosen and run by me, which means I know exactly what they look like going in, a real attacker wouldn’t be kind enough to announce what kind of attack they’re exploiting. And the custom rule I wrote closes exactly one specific gap with a frequency proxy, not real periodicity detection. Like I mentioned in that section, the real limitation is how easy it’d be for something to bypass it or slip through.