It can't see it?
A SYN scan against the Homelab produced zero alerts twice, for two completely unrelated infrastructure bugs, before the network layer finally caught it clean.
This is the first of three attacks against the Homelab, Wazuh watching the host, Suricata watching the wire. Honestly, I thought this scan would be a lot easier than what I had to do in reality.
Getting onto the isolated network
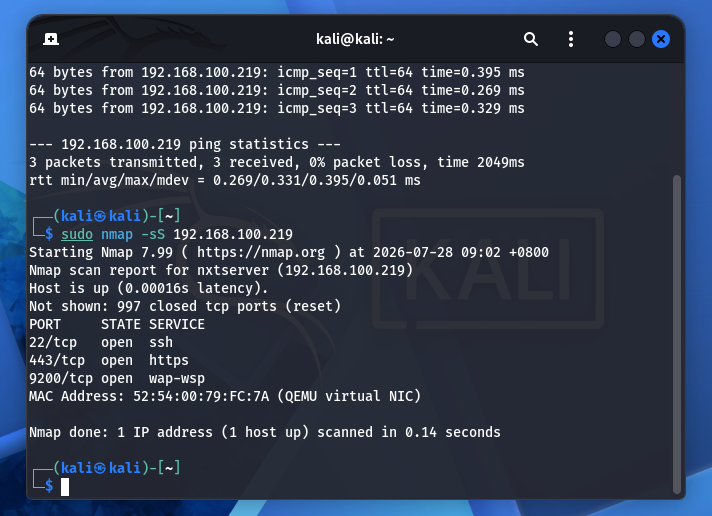
Before any of this, nxtserver and my attacker box kali-pentest both moved off the ordinary NAT network and onto lab-isolated, a libvirt network with no forward path out at all. I’d built and verified it, ping 8.8.8.8 inside it returns “Network is unreachable,” not a timeout, so there was nothing to double check here. Then I ran the actual attack: nmap -sS 192.168.100.219 from Kali, a default top-1000-port SYN scan.
The first scan produced nothing
Suricata’s eve.json showed the scan happening, flow events covering all roughly 1000 ports the scan touched, so packet capture wasn’t the problem. But zero alerts. I checked the enabled ruleset for gaps first and found hundreds of legitimate scan signatures, including a dedicated SSH-scan rule, so it wasn’t a missing-signature problem either.
It was HOME_NET. Back when I first set up Suricata, I’d set it to the standard broad private-IP range, 192.168.0.0/16 and friends, which was fine when nothing on that range was attacking anything. Now both my target and my attacker were inside it. Almost every scan signature is written $EXTERNAL_NET -> $HOME_NET, and Suricata had classified Kali as trusted, which was why no alerts were firing.
I narrowed HOME_NET down to just the actual protected server, 192.168.100.219/32, and restarted Suricata.
The second scan fired, and the dashboard stayed empty anyway
Five ET SCAN alerts showed up in eve.json immediately. Nothing reached the dashboard. I’d half expected this to be another auth problem like the password issue, but it wasn’t. The Wazuh agent’s config still pointed at nxtserver’s old pre-migration address, 192.168.122.219, as the manager’s IP, a self-reference left over from when the manager (running in Docker on the same box) was reachable at the VM’s old external address (when it was using NAT). That address stopped existing the moment the NIC moved to lab-isolated. The agent had been failing to connect since the reboot, silently, while systemctl status kept reporting it as active (running).
Worse, this one wasn’t recoverable by just fixing and restarting. The manager had never received those five alerts in the first place, there was nothing to backfill, and the agent’s read offset in eve.json had already moved past those lines. I had to re-run the scan after fixing it. I pointed the manager address at 127.0.0.1 instead of re-adding the new IP, so it can’t break the same way again next time the network changes.
The clean run
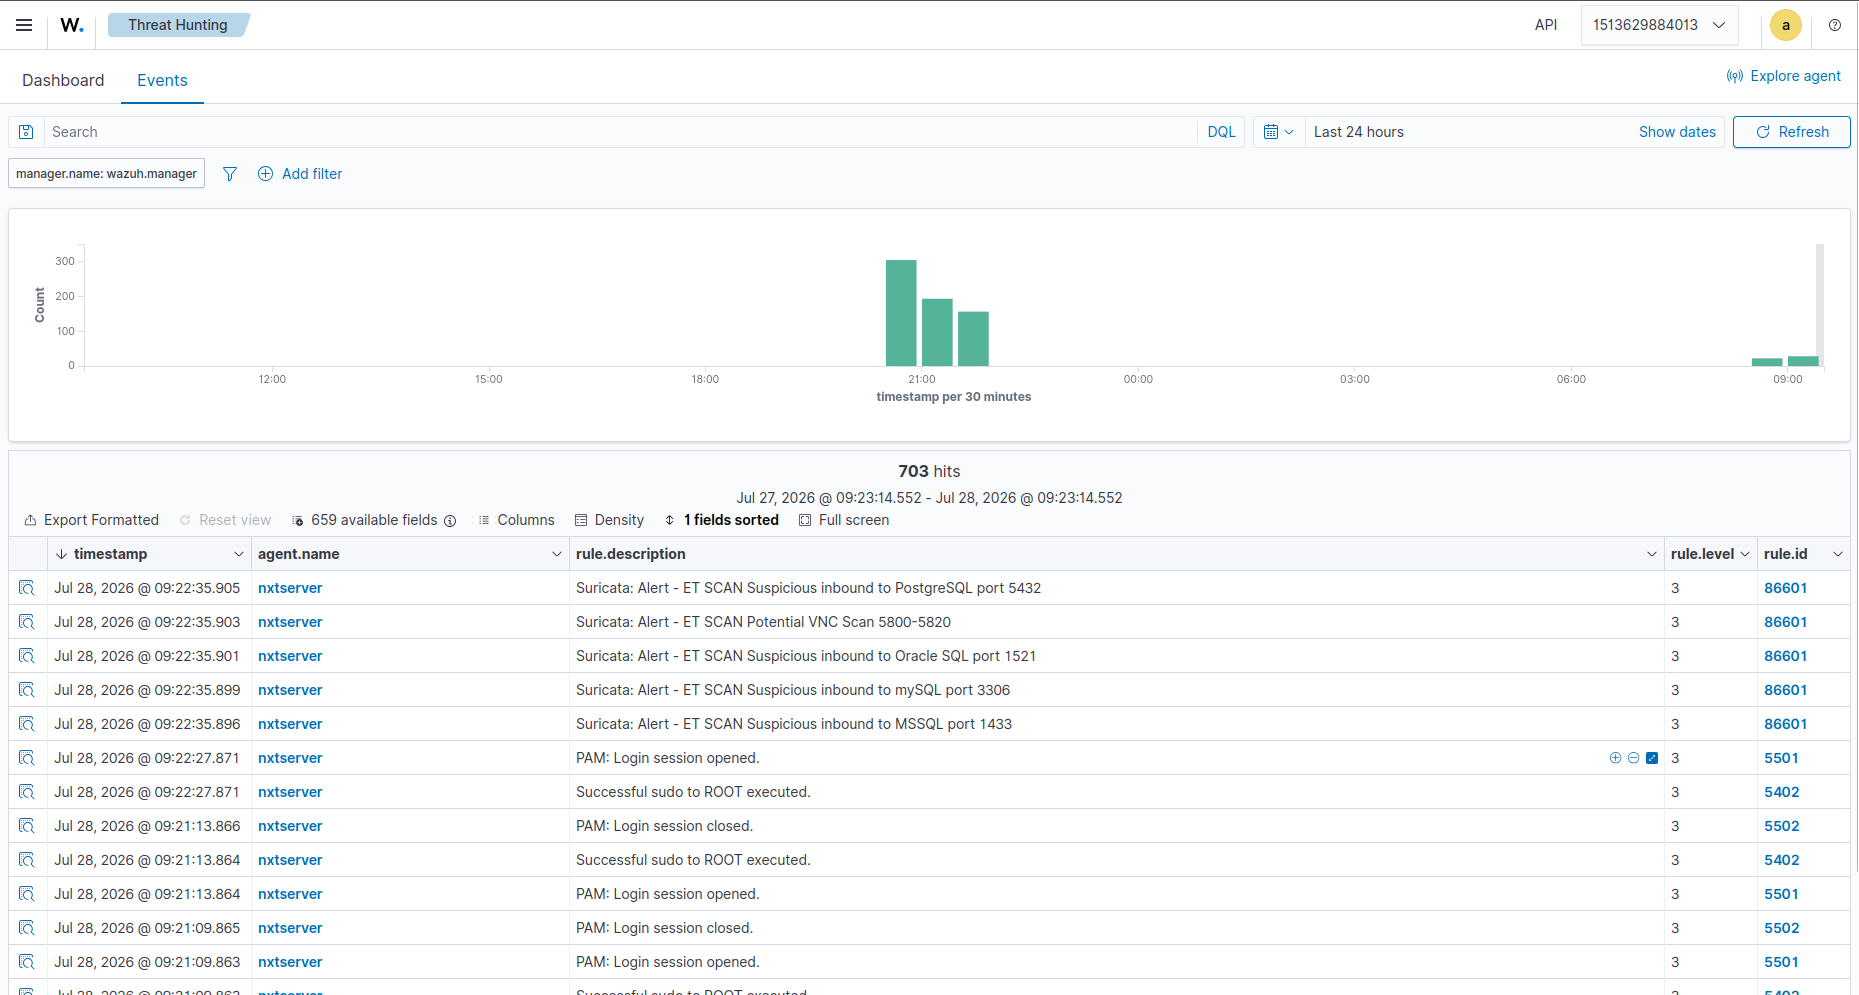
Third attempt, full pipeline working end to end. Alerts landed in eve.json the same second as the scan and were visible in the dashboard within 10 to 15 seconds:
ET SCAN Suspicious inbound to mySQL port 3306(sid 2010937)ET SCAN Suspicious inbound to MSSQL port 1433(sid 2010935)ET SCAN Potential VNC Scan 5800-5820(sid 2002910)ET SCAN Suspicious inbound to PostgreSQL port 5432(sid 2010939)ET SCAN Suspicious inbound to Oracle SQL port 1521(sid 2010936)
Why only the network layer ever saw this
Sitting in that same dashboard view, right next to the five scan alerts, were ordinary PAM login and sudo events from my own SSH sessions while I was debugging. The host layer was actively logging things the entire time. It just had nothing to say about the scan, because a SYN scan never completes a TCP handshake. There’s no connection, no auth attempt, no service log line, nothing a host-based sensor could observe no matter how well it’s configured. Suricata doesn’t have that problem because it isn’t waiting for a connection to exist. It’s watching the wire, where the scan is fully visible whether or not anything on top of it ever completes.
What I took away
The interesting part of this attack wasn’t the scan detection itself, ET Open ships hundreds of scan signatures, that part was a walk in the park. It was that I broke the pipeline twice before I got there, and both breaks were the same shape as each other. A service reported itself active while NOT doing its job! systemctl status said active. Docker said the agent was running. Neither one meant the alert was actually reaching anywhere. Checking the actual endpoint, eve.json, ossec.log, the dashboard itself, was the only thing that ever told me the truth.
Limits
This only proves structural blindness for scan-shaped attacks, ones that never complete a connection. It says nothing yet about attacks that do complete a session and still slip past the host layer for other reasons, that’s a different kind of gap I ran into next.